Written by Michael LaPick
Healthcare Writer
We aim to help you make informed healthcare decisions. While this post may contain links to lead generation forms, this won’t influence our writing. We follow strict editorial standards to give you the most accurate and unbiased information.
Key findings:
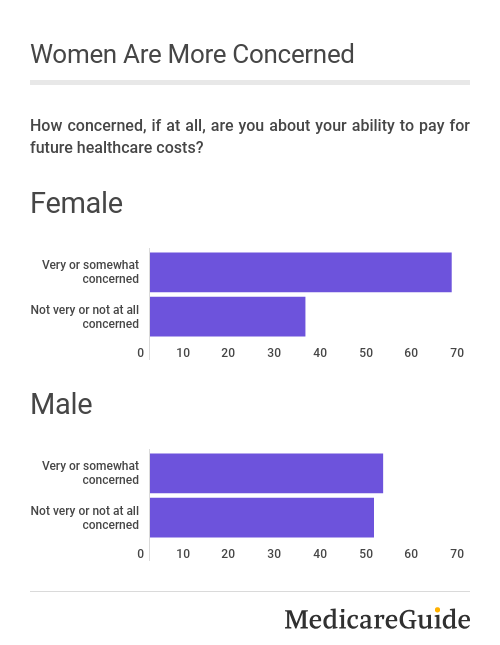
- Almost two-thirds of women (66%) are concerned about their ability to pay for future healthcare compared to just over half (51%) of men.
- 18% of women report trouble paying for prescription drugs within the last year, compared to just 11% of men.
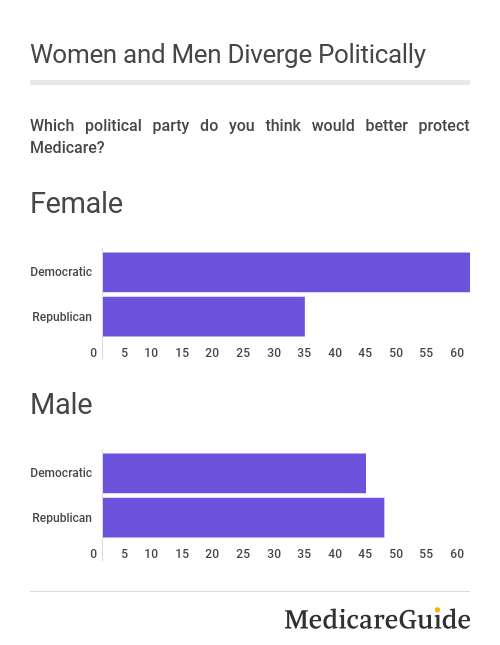
- Six in 10 (60%) women said Democrats would better protect Medicare, compared to roughly four in 10 (43%) men.
Women on Medicare worry more than men about their ability to pay future healthcare costs.
Roughly two-thirds of females (66%) said they were either somewhat or very concerned compared to just over half (51%) of males.
That’s among the key takeaways in this second report on a new healthcare cost survey of Medicare recipients 65 plus by MedicareGuide.com.
Women were also more likely than men to report having trouble paying health related costs within the past year, by a margin of 30% to 20%.
The largest disparity lay in the cost of prescription drugs: 18% for women, 11% for men.
Male respondents were more likely to get generics (45% vs 42%) or a larger supply (40% vs 35%) to save money on prescription drugs within the past year.
The gender divide was also reflected in respondents’ political views. Six in 10 (60%) women said Democrats would better protect Medicare, compared to a little over four in 10 (43%) men.
Nearly half (46%) of male respondents said Republicans would do a better job, compared to just one-third (33%) of female survey respondents.
Healthcare Cost Concerns Decline by Age
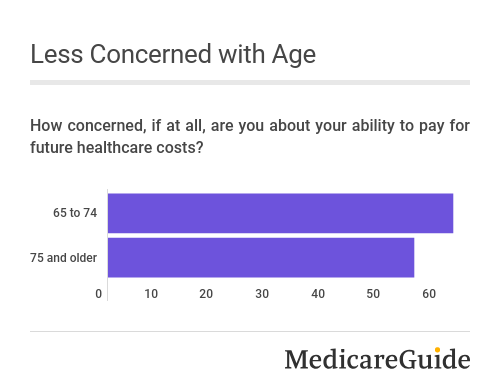
By age bracket, younger respondents (65 to 74) were more likely to report concerns about their ability to pay for future healthcare costs than those 75 and up.
62% of the 65 to 74 bracket said they were very or somewhat concerned.
By contrast, only 55% of respondents aged 75 and older cited concerns about their ability to pay for future healthcare costs.
Medicare recipients also split by age on paying for healthcare.
Nearly three in 10 (28%) 65 to 74 year-olds said they had trouble paying healthcare bills within the last year.
Less than two in 10 (18%) Medicare beneficiaries aged 75 and older described similar difficulties.
17% of the 65 to 74 bracket said they faced trouble affording prescription drugs, compared to only 11% of respondents aged 75 and older.
Southerners, Westerners Face Trouble Paying for Healthcare
Responses on paying for future healthcare also varied geographically.
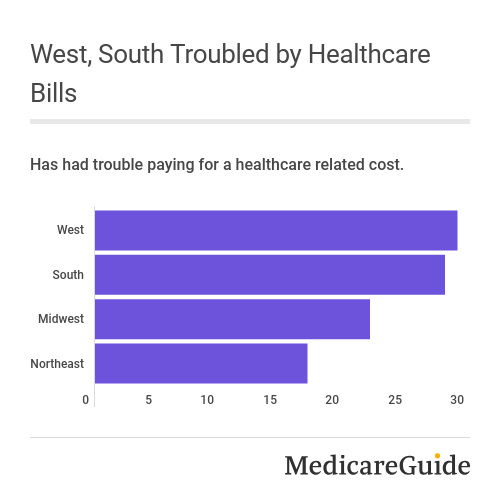
29% of Medicare recipients aged 65 plus in the West reported trouble paying health related costs within the past year, and a similar 28% in the South.
But only 22% of respondents from the Midwest said they had difficulties affording healthcare, and just 17% in the Northeast.
Prescription drugs accounted for much of the variance. 20% of Westerners and 16% percent of Southerners reported trouble paying for prescription drugs compared to 10% of Midwesterners and 11% of Northeasterners.
Surprise medical bills also confounded people in West and South, with 35% of respondents from each region saying they’d received one in the last two years, compared with 28% in the Midwest and 27% in the Northeast.
Asked which political party they think would better protect Medicare, beneficiaries in all regions except the South favored the Democratic Party over the Republican Party by a margin of at least 10%.
Southerners split evenly, with 45% each favoring Democrats and Republicans.
Education Correlates with Views on Medicare’s Future
65 plus Medicare beneficiaries also broke politically by level of education. Respondents with post-graduate education favored the Democratic Party over the Republican Party by 63% to 31%.
Those with no high school or a high school degree said by a ratio of 56% to 37% that Republicans would better protect Medicare in the future.
But this political split was not seen by income level. Respondents with under $40k, $40k to $80k, and over $80k in income all chose the Democratic over the Republican Party to ensure Medicare’s future – by margins of 18%, 6% and 13% respectively.
Methodology
MedicareGuide.com commissioned YouGov Plc to conduct the survey. All figures, unless otherwise stated, are from YouGov Plc. The total sample size was 1,126 adults. Fieldwork was undertaken on October 5-8, 2020. The survey was carried out online. The figures have been weighted and are representative of all US adults (aged 65+). The margin of error is 2.8%, plus or minus.
Thank you for your feedback!


